

Insight into numbers and work
Figures from the systems where they arise, together in one overview. Nobody has to run an export for it.
Four signs you steer on last month's numbers
- 1
Reports in Excel
Every month someone copies numbers from three systems into one sheet. It takes days and is never fully current.
- 2
Debate about the numbers
Two overviews, two outcomes. The meeting is about which number is right instead of about the decision.
- 3
No view of work in progress
How many requests are open, how long does a file take, where does it stall? You hear it when a customer calls.
- 4
Steering by feel
Margins, commissions, lead times. You roughly know how things are going, the evidence follows later.
Today's numbers, without copy and paste
Dashboards that live
Key figures from your connected systems, refreshed as soon as the source changes.
All sources together
Accounting, CRM, bank and your own applications in one view. Without manual exports.
The right view per role
Management sees margin and revenue, the team sees workload and lead time.
Signals in time
A threshold crossed or a file that stalls? You get a notification before it becomes a problem.
Reports on schedule
Monthly and quarterly reports come from the same source. The same format every time.
Reliable foundation
One data model in Azure, with control over origin and access per role.
A finance app as the base, custom dashboards on top
Finance app
Our foundation for financial insight: transactions, categories, margins and reports. We connect your sources and set up the key figures.
Book a demoDashboards on your own process
For operational insight, such as workload, commissions or lead times, we build dashboards on your process. One data model, one way of maintaining it.
See examplesFrom defining key figures to a dashboard that grows with you
Analysis and concept
We start by understanding how your business works, what you want to digitise and why.
UX and technical design
We make sure it works logically for users and is technically sound.
Build, usually in .NET and Azure
Built securely and to scale, without frills. On .NET and Azure, or on the technology that fits your situation better.
Maintenance and development
We know your software and your process. Changes, updates and new requests are picked up in a steady rhythm.
Insight we built
All casesRegistering, tracking and settling loans
Files, payments and commission for short-term business financing now live in one environment.
Read the case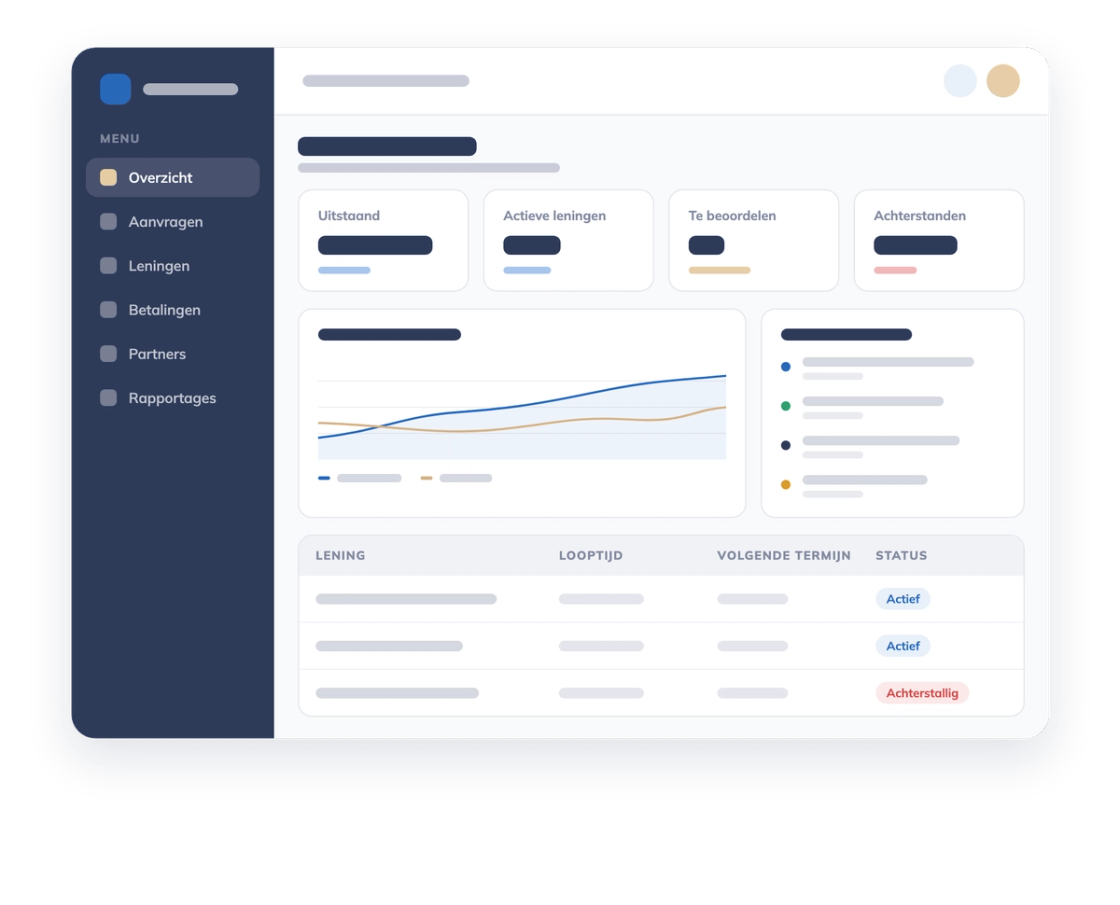
Which numbers do you want to see every morning?
The figures are usually somewhere already. In a first conversation we work out which system holds them and what it takes to bring them together.